

















Most climate risk tools
fall short
Global grids are too coarse
A global model cell can be larger than your whole site. Your warehouse, its parking and the river behind it end up as one value.
Scores without evidence don’t hold up
Auditors and insurers ask where a number comes from. A black-box rating gives you nothing to show them.
Risk without a cost doesn’t get budget
A heat map rarely moves a CFO. Expected losses per site and per hazard do.
Climate risks driving business decisions for a robust future
How our climate risk assessments are used
Report under CSRD and IFRS S2
Scores, scenarios and time horizons for your ESRS E1 physical risk disclosure, with a method you can explain to your auditor.
Comprehensive risk management
Exposure per hazard with the measurements behind it, plus estimated property damage and business interruption, for your insurer, risk committee and board.
Biodiversity & protected zones
Each site is screened against biodiversity, water protection, pollution, heritage and geohazard zones.
M&A due diligence
Check the hazards and nearby protected zones of a target’s sites before you close the deal, buy land or sign a lease.
How it works
How an assessment is built
Six steps, run automatically from authoritative public data and fixed rules. You review the result and correct any input; everything downstream recalculates.
- Step 1
Find the sites
Start from your own site list, or only your company name. We combine company research with official registers to build the site register.
- Step 2
Draw the real footprint
Each site is matched to its cadastral parcels, so hazards are measured over your land instead of at one coordinate. Where no cadastre exists, a fallback perimeter is used and flagged.
- Step 3
Map what stands on it
Buildings and their heights from LiDAR, and the paved, green and water surfaces. A 60 cm flood means something different on a sealed yard than on a meadow.
- Step 4
Screen protected zones
Biodiversity, water protection, pollution, heritage and geohazard zones, with the overlap or distance for each.
- Step 5
Measure 15 hazards
For today and for 2050 under two IPCC scenarios, from the finest data available at that location.
- Step 6
Score on one scale
Every hazard from 0 to 5, comparable across sites, regions and horizons.
Go as deep as each site needs
Run exposure on every site. Add operational and financial impact for the sites that matter most.
- Level 1 · Exposure
Which hazards matter where?
Scores per hazard and per site, today and in 2050, with site narratives and maps.
You provideAddresses or coordinates - Level 2 · Operational impact
What happens to the site when it hits?
Asset sensitivity, critical equipment, people exposed and the likely disruption per hazard.
Critical assetDowntimeTransformer roomPluvial flood6 dCold storeHeat stress3 dLoading docksWindstorm1 dYou provideAn asset register for the site - Level 3 · Financial impact
What could it cost each year?
Expected annual loss, split into property damage, business interruption and productivity loss, per hazard and scenario.
Expected annual loss2050 · SSP2-4.5€ 410k per year- Property damage€ 180k
- Business interruption€ 160k
- Productivity loss€ 70k
You provideAsset & activity details, site P&L
What we measure
15 hazards, three horizons
Each hazard is assessed where it is physically relevant to the site, for today’s climate and for 2050 under two IPCC AR6 scenarios.
- TodayCurrent climate
- 2050, SSP2-4.5Intermediate emissions
- 2050, SSP5-8.5High emissions
Floods
- Fluvial flood
- Pluvial flood
- Coastal flood
- Extreme precipitation
Heat
- Heat stress
- Winter weather
Wind
- Windstorm
- Chronic wind
- Tropical cyclone
- Tornado
Water availability
- Drought
- Groundwater stress
Ground and vegetation
- Subsidence and karst
- Landslide and erosion
- Wildfire
Local data first
Where regions publish their own hazard maps, we use them. In Belgium that means the Flemish, Walloon and Brussels flood maps on grids of about 2 m, measured over your parcels rather than at one point.
International reference data elsewhere
For other countries, and for hazards no region covers, we draw on Copernicus ERA5, the European Commission’s JRC, WRI Aqueduct and NASA’s downscaled CMIP6 projections. Scores are calibrated so a 3 means the same in Ghent as in Kansas.
Traceable by design
Every score has a source
Scoring runs on fixed thresholds: the same inputs always give the same result. Behind each score sits the raw measurement, its unit and the dataset it came from.
| Return period | Max. depth | Site flooded |
|---|---|---|
| 1 in 10 years | 0.12 m | 9% |
| 1 in 100 years | 0.38 m | 34% |
| 1 in 1,000 years | 0.61 m | 52% |
Output easily traceable
- Open the raw measurement behind any score
- Correct an input: everything downstream recalculates, on record
- Ask the AI expert why one site scores higher than another
- Export site reports, and the full data set for your auditor
Beyond climate
Biodiversity & protected zones
Used in
- ESRS E2, E3 and E4
- EU Taxonomy DNSH
- Permits
For banks and investors
Send company names. Get site-level risk back.
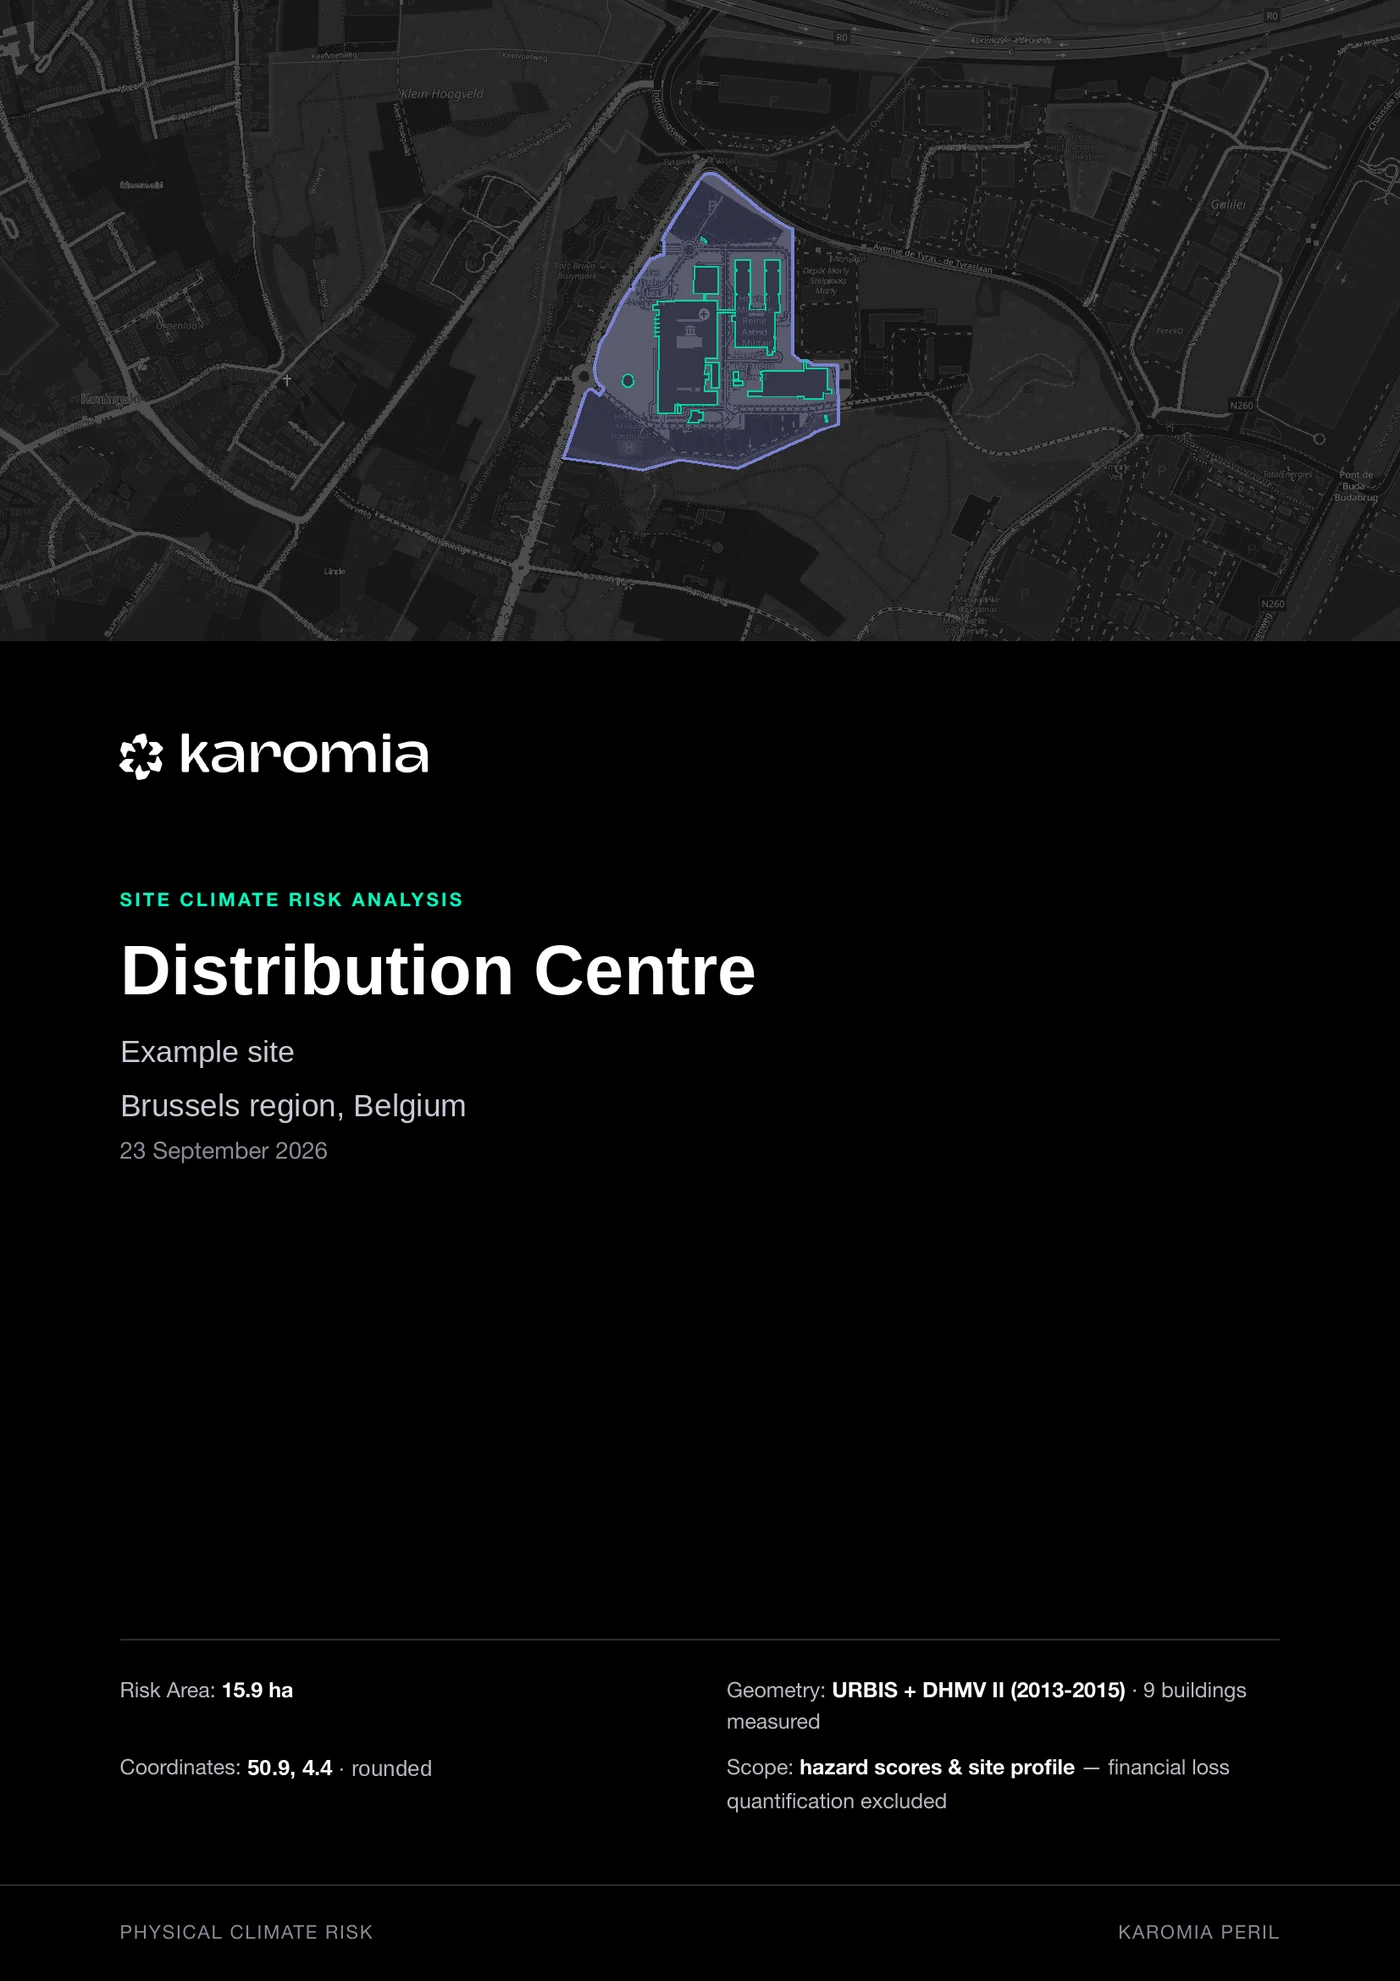
Most borrowers and portfolio companies can’t hand you a clean list of their sites. We find them, map each one to its parcels and return hazard and nature data per site, ready for your own risk models.
- 1
Send company names
A list of borrowers or portfolio companies, by name or company number.
- 2
We find their sites
Karomia’s deep-search finds plants, depots, warehouses and offices, from company sources and official registers, each with its source.
- 3
Each site gets a risk area
Cadastral parcel references and a polygon where available, a coordinate-based fallback where not.
- 4
Data back your way
Hazard, scenario and nature data per site, as a batch feed over API, or in the platform.
Use it for
- Portfolio and collateral screeningLink loans and holdings to the physical risk of the sites behind them.
- Climate and nature risk managementFeed parcel-level exposure and protected-zone data into stress tests and Pillar 3 ESG work.
- Investment due diligenceAttach a site-level climate and environmental risk report to the investment memo.
- Built to scaleDesigned for thousands of companies, with the output schema agreed with your data team.
Connected to your sustainability reporting
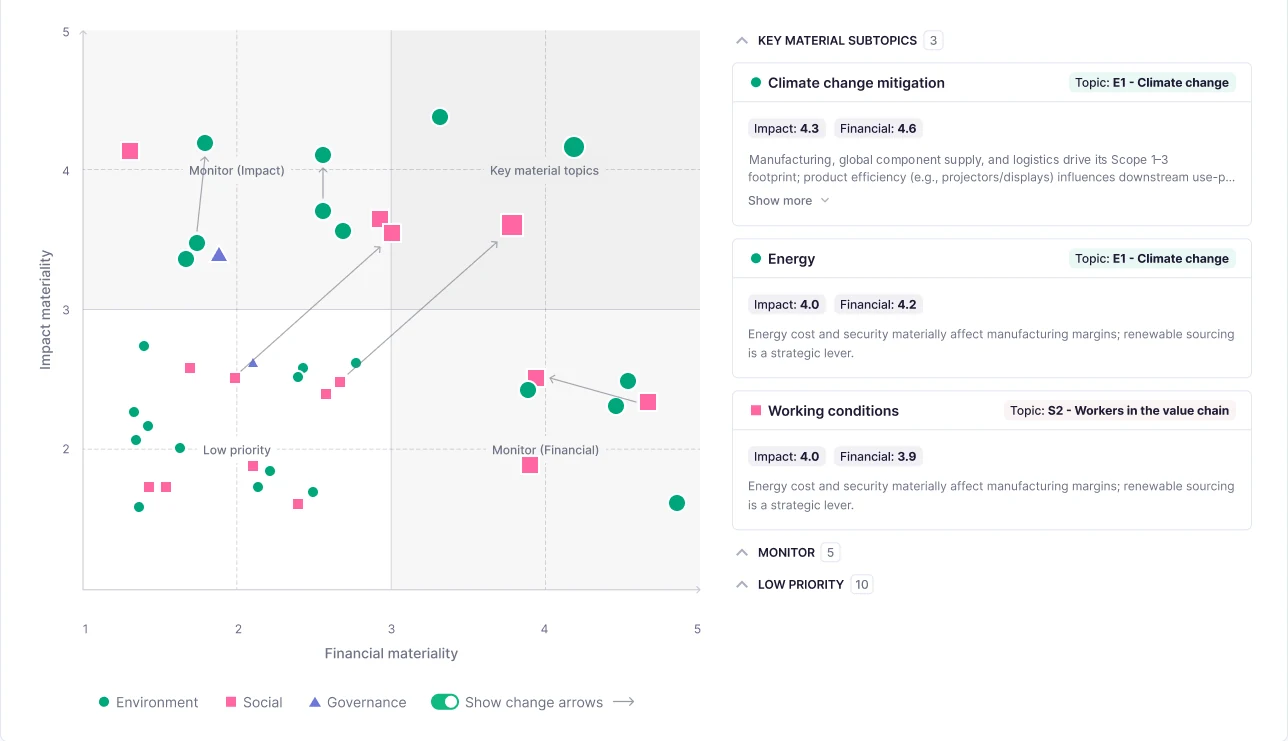
Physical risks in your double materiality assessment
Your climate risk results feed the financial materiality of climate change, with their evidence.
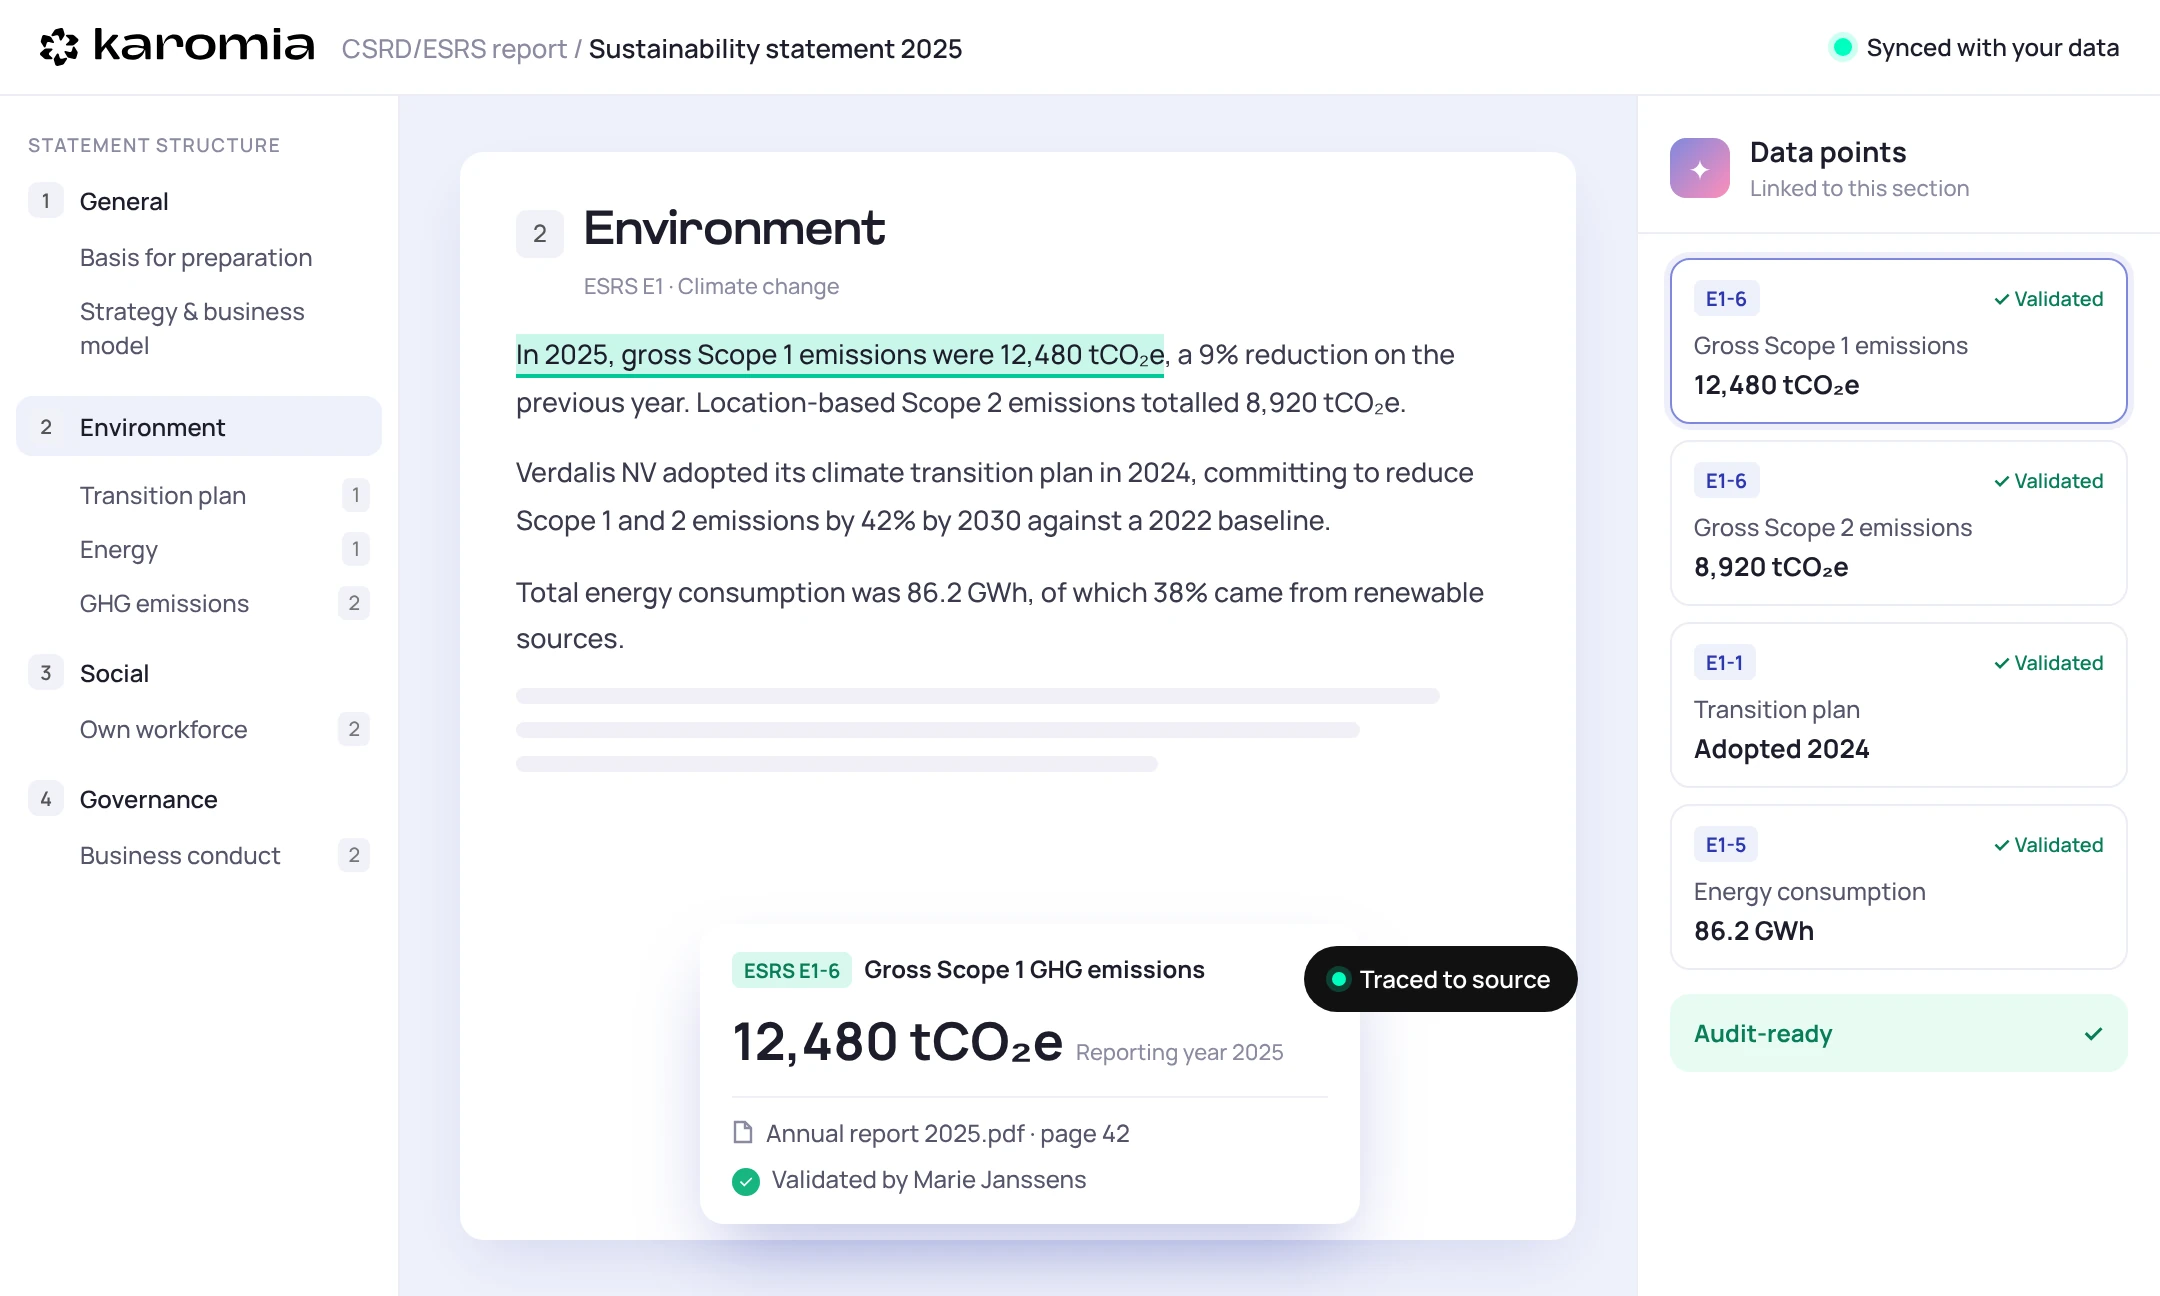
Ready for your ESRS E1, IFRS S2 and VSME reporting
Scenarios, horizons and site results flow into your physical risk disclosure, without copying data between tools.
Questions about climate risk assessment
Don't see your question? Talk to our team, we're happy to help.
A climate risk assessment shows how exposed a company’s sites are to physical climate hazards such as floods, heat, storms and drought, today and under future climate scenarios. It can go further and estimate the operational and financial impact of those hazards.
Under ESRS E1, companies explain how they identified physical climate risks across their operations, which scenarios and time horizons they used, and the anticipated financial effects. A site-level assessment with a documented method gives you the basis for each of those points.
Today’s climate plus 2050 under SSP2-4.5 (intermediate emissions) and SSP5-8.5 (high emissions), following the IPCC AR6 definitions. Projections use the median of a multi-model CMIP6 ensemble.
Yes. Sites anywhere get international reference data, and we add finer local datasets where countries publish them. Precision depends on what is measured locally, and the assessment tells you which data was used.
Only for the financial impact level. Exposure scores need nothing more than your site locations.
Yes. We find the company’s sites from its own publications and official registers, and you confirm or adjust the list before the assessment runs.
See it on one of your own sites
Share an address in the demo and we’ll walk through its hazards, scenarios and what a deeper assessment would add.